┌──(root㉿kali)-[~] └─# nmap --min-rate 10000 -p- 192.168.2.9 Starting Nmap 7.94SVN ( https://nmap.org ) at 2025-09-04 11:24 CST Nmap scan report for 192.168.2.9 Host is up (0.00029s latency). Not shown: 65532 closed tcp ports (reset) PORT STATE SERVICE 22/tcp open ssh 80/tcp open http 9090/tcp open zeus-admin MAC Address: 08:00:27:8C:F9:3A (Oracle VirtualBox virtual NIC)
Nmap done: 1 IP address (1 host up) scanned in 5.56 seconds
┌──(root㉿kali)-[~] └─# nmap --min-rate 10000 -sT -sV -sC -O -p22,80,9090 192.168.2.9 Starting Nmap 7.94SVN ( https://nmap.org ) at 2025-09-04 11:27 CST Nmap scan report for 192.168.2.9 Host is up (0.0015s latency).
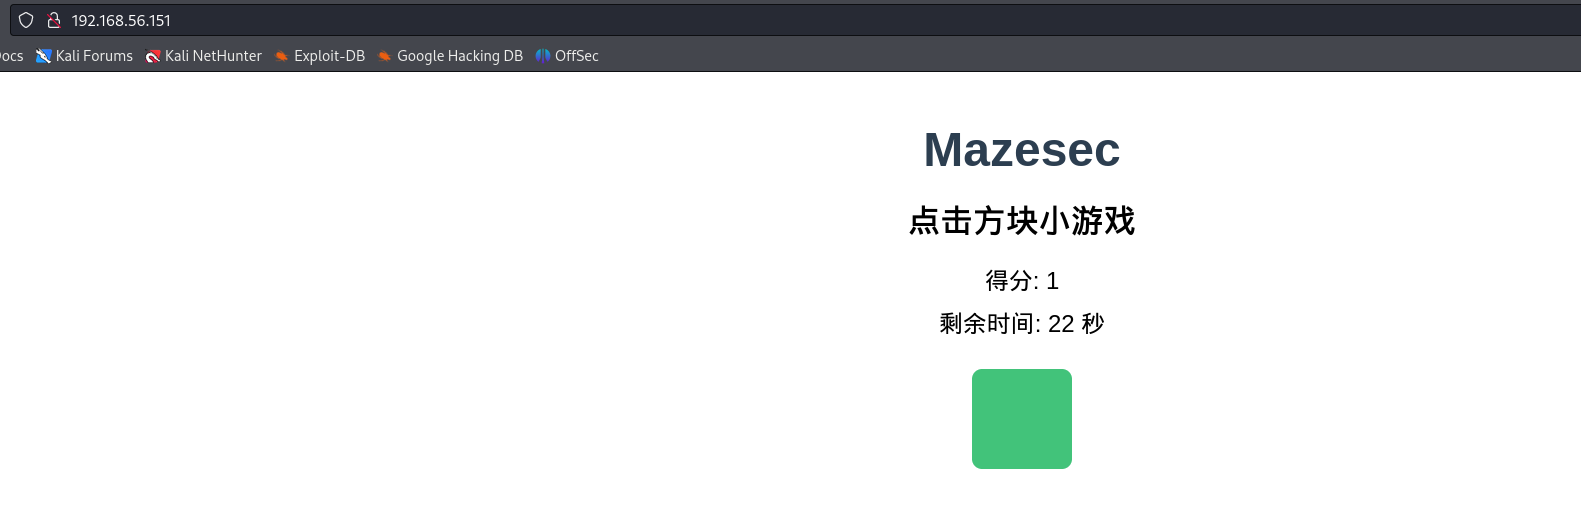
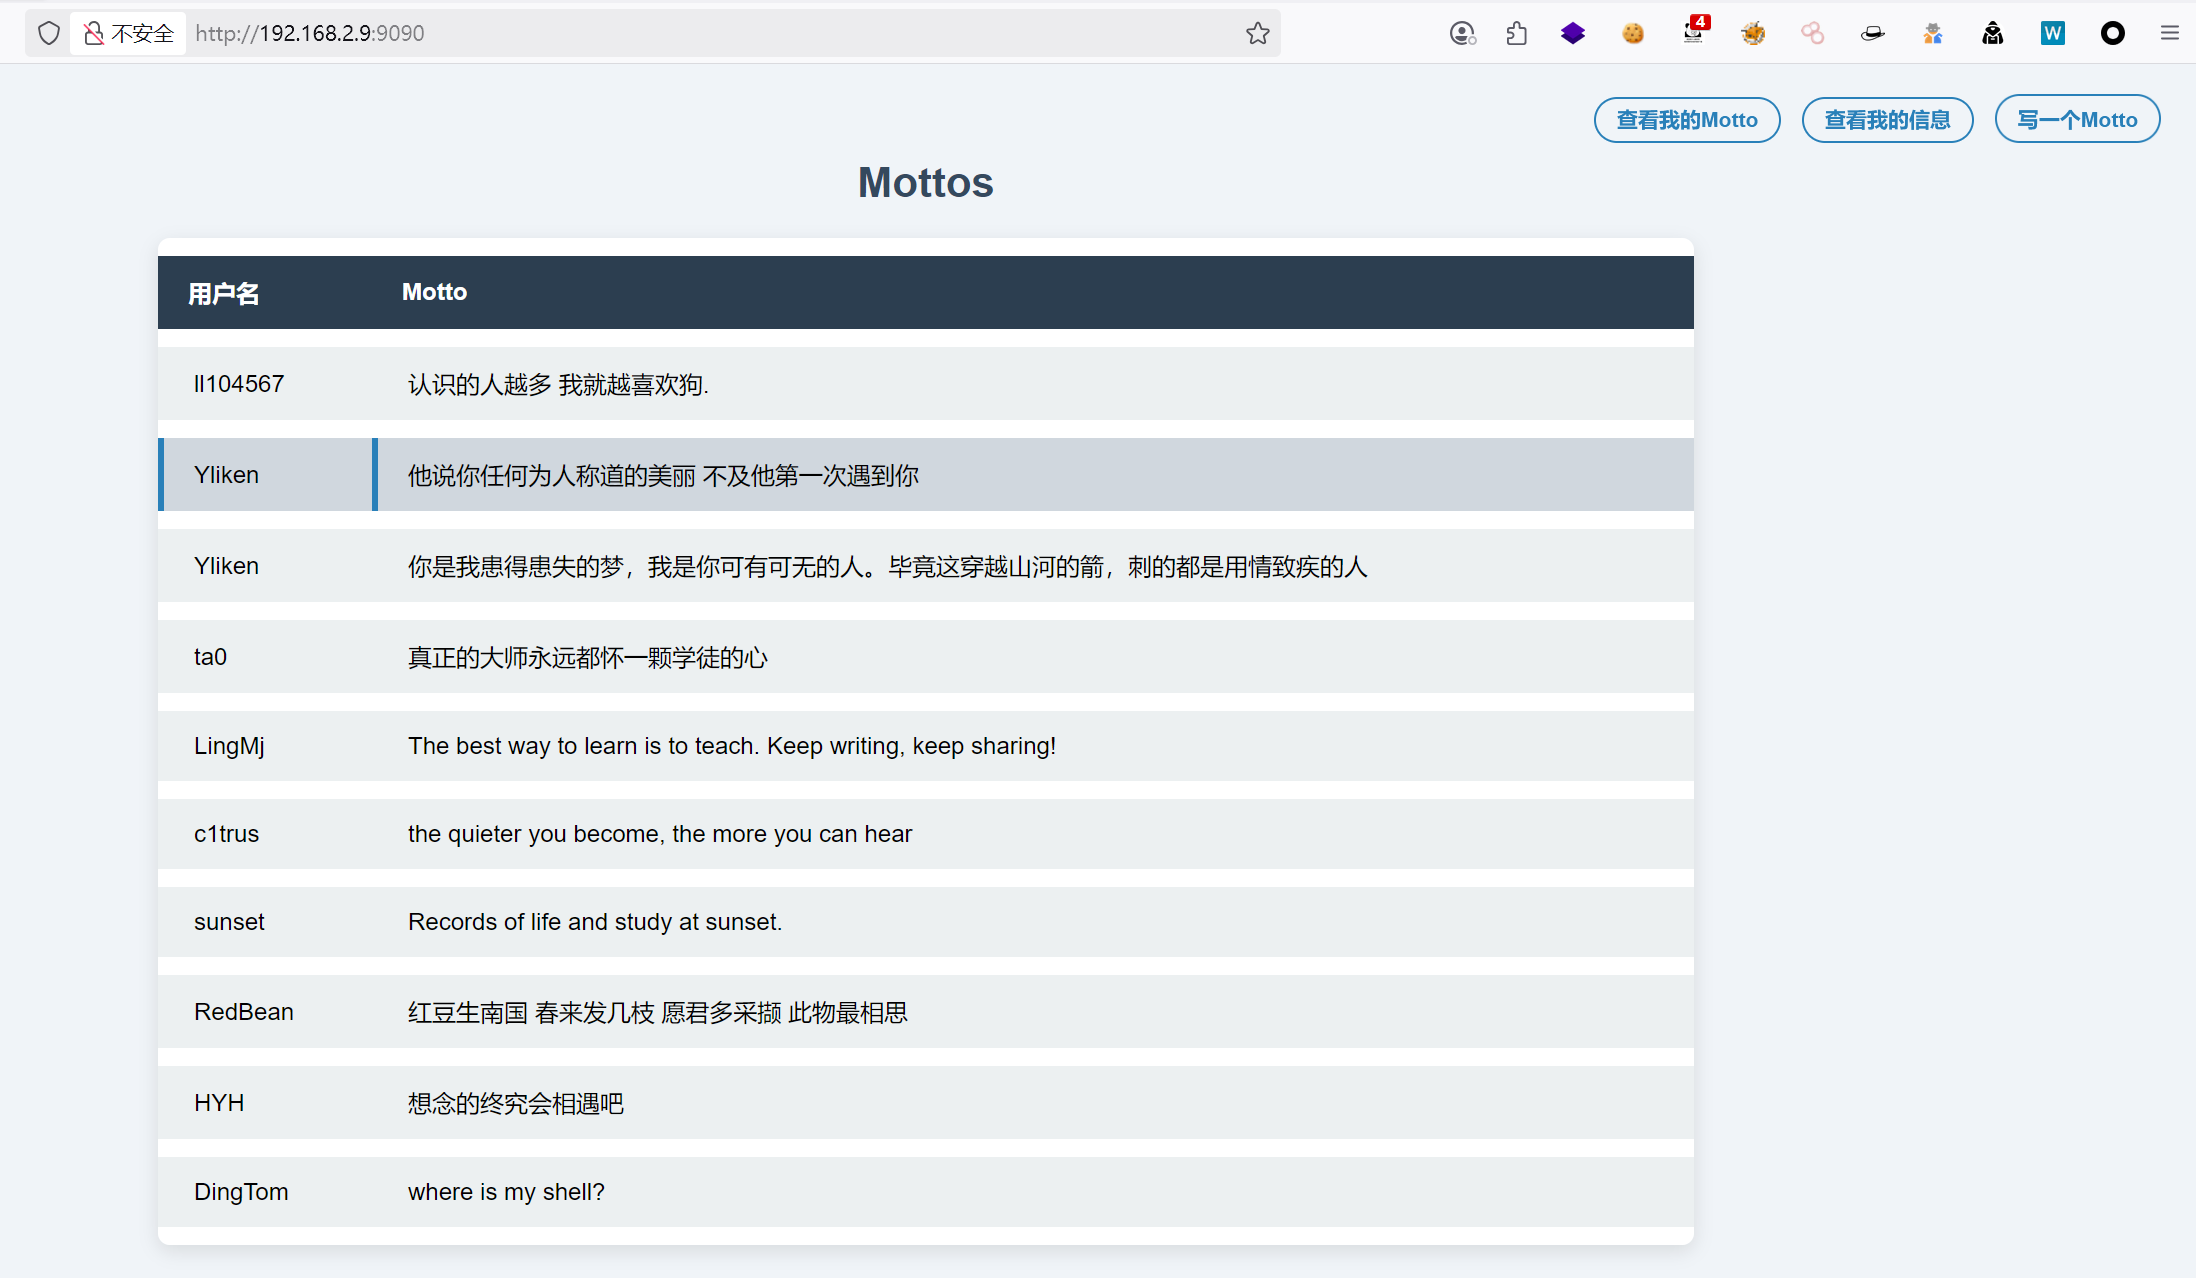
PORT STATE SERVICE VERSION 22/tcp open ssh OpenSSH 8.4p1 Debian 5+deb11u3 (protocol 2.0) | ssh-hostkey: | 3072 f6:a3:b6:78:c4:62:af:44:bb:1a:a0:0c:08:6b:98:f7 (RSA) | 256 bb:e8:a2:31:d4:05:a9:c9:31:ff:62:f6:32:84:21:9d (ECDSA) |_ 256 3b:ae:34:64:4f:a5:75:b9:4a:b9:81:f9:89:76:99:eb (ED25519) 80/tcp open http Apache httpd 2.4.62 ((Debian)) |_http-title: \xE7\x82\xB9\xE5\x87\xBB\xE6\x96\xB9\xE5\x9D\x97\xE5\xB0\x8F\xE6\xB8\xB8\xE6\x88\x8F |_http-server-header: Apache/2.4.62 (Debian) 9090/tcp open zeus-admin? | fingerprint-strings: | GenericLines, SqueezeCenter_CLI: | HTTP/1.1 400 Bad Request | Content-Type: text/plain; charset=utf-8 | Connection: close | Request | GetRequest: | HTTP/1.0 200 OK | Content-Type: text/html; charset=utf-8 | Date: Thu, 04 Sep 2025 03:28:00 GMT | <!DOCTYPE html> | <html lang="zh-CN"> | <head> | <meta charset="UTF-8" /> | <title>Mottos</title> | <link rel="stylesheet" href="/static/css/index.css" /> | <style> | .top-right-auth { | position: fixed; | top: 20px; | right: 30px; | font-size: 14px; | font-family: Arial, sans-serif; | z-index: 1000; | .top-right-auth a, .top-right-auth button { | color: #2980b9; | text-decoration: none; | margin-left: 10px; | font-weight: 600; | border: 1.5px solid #2980b9; | padding: 6px 14px; | border-radius: 20px; | background: none; | cursor: pointer; |_ transition: background-color 0.3s, 1 service unrecognized despite returning data. If you know the service/version, please submit the following fingerprint at https://nmap.org/cgi-bin/submit.cgi?new-service : ... MAC Address: 08:00:27:8C:F9:3A (Oracle VirtualBox virtual NIC) Warning: OSScan results may be unreliable because we could not find at least 1 open and 1 closed port Device type: general purpose Running: Linux 4.X|5.X OS CPE: cpe:/o:linux:linux_kernel:4 cpe:/o:linux:linux_kernel:5 OS details: Linux 4.15 - 5.8 Network Distance: 1 hop Service Info: OS: Linux; CPE: cpe:/o:linux:linux_kernel
OS and Service detection performed. Please report any incorrect results at https://nmap.org/submit/ . Nmap done: 1 IP address (1 host up) scanned in 135.01 seconds
3.UDP端口扫描
1 2 3 4 5 6 7 8 9 10
┌──(root㉿kali)-[~] └─# nmap -sU --top-ports 100 192.168.2.9 Starting Nmap 7.94SVN ( https://nmap.org ) at 2025-09-04 14:38 CST Nmap scan report for 192.168.2.9 Host is up (0.00062s latency). All 100 scanned ports on 192.168.2.9 are in ignored states. Not shown: 61 closed udp ports (port-unreach), 39 open|filtered udp ports (no-response) MAC Address: 08:00:27:8C:F9:3A (Oracle VirtualBox virtual NIC)
Nmap done: 1 IP address (1 host up) scanned in 59.18 seconds
没有开放的udp端口
4.漏洞脚本扫描
1 2 3 4 5 6 7 8 9 10 11 12 13 14 15 16 17
┌──(root㉿kali)-[~] └─# nmap --script=vuln -p22,80,9090 192.168.2.9 Starting Nmap 7.94SVN ( https://nmap.org ) at 2025-09-04 14:21 CST Nmap scan report for 192.168.2.9 Host is up (0.00033s latency).
PORT STATE SERVICE 22/tcp open ssh 80/tcp open http |_http-dombased-xss: Couldn't find any DOM based XSS. |_http-csrf: Couldn't find any CSRF vulnerabilities. |_http-stored-xss: Couldn't find any stored XSS vulnerabilities. |_http-vuln-cve2017-1001000: ERROR: Script execution failed (use -d to debug) 9090/tcp open zeus-admin MAC Address: 08:00:27:8C:F9:3A (Oracle VirtualBox virtual NIC)
Nmap done: 1 IP address (1 host up) scanned in 31.53 seconds
The programs included with the Debian GNU/Linux system are free software; the exact distribution terms for each program are described in the individual files in /usr/share/doc/*/copyright.
Debian GNU/Linux comes with ABSOLUTELY NO WARRANTY, to the extent permitted by applicable law. Last login: Thu Jul 31 04:01:36 2025 from 192.168.56.103 redbean@motto:~$ id uid=1000(redbean) gid=1000(redbean) groups=1000(redbean)
五、权限提升
查看sudo属性,发现需要密码
1 2 3 4 5 6 7 8 9 10 11
redbean@motto:~$ sudo -l sudo: unable to resolve host motto: Temporary failure in name resolution
We trust you have received the usual lecture from the local System Administrator. It usually boils down to these three things:
#1) Respect the privacy of others. #2) Think before you type. #3) With great power comes great responsibility.
echo -e "\033[1;34m[INFO]\033[0m Initializing environment checks:" for step in A B C; do echo -e "\033[1;33m ● Module ${step} status: OK (ver $(($RANDOM%5+1)).$(($RANDOM%20)).$(($RANDOM%500)))\033[0m" sleep 0.12 done
echo -e "\033[1;34m[INFO]\033[0m Running diagnostic sequence:" for step in {1..3}; do echo -e "\033[1;35m → Executing test ${step} of 3\033[0m" sleep 0.2 done
for ((i=WAIT_TIME; i>=0; i--)); do case $((i%4)) in 0) COL="34" ;; # 蓝 1) COL="32" ;; # 绿 2) COL="31" ;; # 红 3) COL="36" ;; # 青 esac
case $((i%2)) in 0) echo -e "\033[1;${COL}m>> Waiting T-${i} seconds...\033[0m" ;; 1) echo -e "\033[1;${COL}m>> Countdown: ${i}\033[0m" ;; esac
[ $i -gt 0 ] && sleep 1 done
RESULTS=( "Diagnostics complete." "All systems nominal." "No errors detected." "System stable." )
FINAL_MSG=${RESULTS[$RANDOM % ${#RESULTS[@]}]} echo -e "\033[1;32m${FINAL_MSG}\033[0m" echo -e "\033[1;34mThank you for using the system monitor.\033[0m"
[INFO] Initializing environment checks: ● Module A status: OK (ver 4.17.190) ● Module B status: OK (ver 2.4.482) ● Module C status: OK (ver 2.5.116) Random seed value: 26001 [INFO] Evaluating input parameters... [INFO] Running diagnostic sequence: → Executing test 1 of 3 → Executing test 2 of 3 → Executing test 3 of 3
Waiting period: 3 seconds >> Countdown: 3 >> Waiting T-2 seconds... >> Countdown: 1 >> Waiting T-0 seconds... No errors detected. Thank you for using the system monitor. [STATS] Summary Report: Processes checked: 74 /opt/new.sh: line 60: bc: command not found CPU load average: Uptime (hours): 31